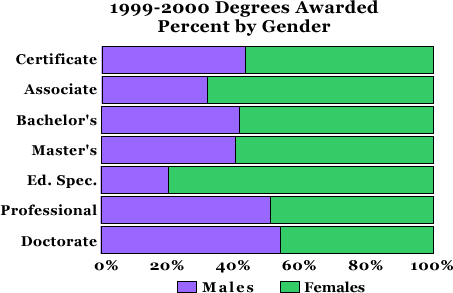
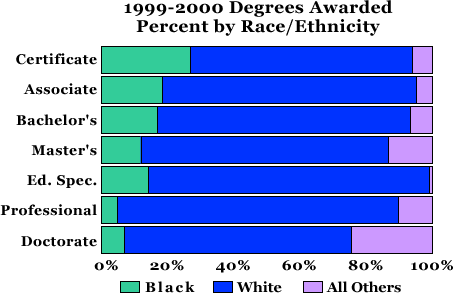
Degrees and Certificates Conferred By Level
FY1991 - FY2000
| Fiscal Year | ||||||||||
|---|---|---|---|---|---|---|---|---|---|---|
| 1991 | 1992 | 1993 | 1994 | 1995 | 1996 | 1997 | 1998 | 1999 | 2000 | |
| CERTIFICATE | ||||||||||
| Number | 178 | 236 | 254 | 225 | 297 | 450 | 602 | 592 | 579 | 665 |
| Percent | 0.6 | 0.8 | 0.8 | 0.7 | 0.9 | 1.3 | 1.7 | 1.6 | 1.6 | 1.9 |
| ASSOCIATE | ||||||||||
| Number | 4,786 | 5,375 | 5,631 | 6,074 | 6,031 | 5,581 | 5,700 | 5,818 | 4,852 | 4,570 |
| Percent | 16.8 | 17.5 | 17 | 17.6 | 17.5 | 15.9 | 16.1 | 15.5 | 13.4 | 13.2 |
| BACHELOR'S | ||||||||||
| Number | 16,191 | 17,426 | 18,750 | 19,603 | 19,286 | 19,837 | 19,711 | 21,070 | 20,852 | 20,259 |
| Percent | 56.9 | 56.6 | 56.8 | 56.7 | 55.9 | 56.5 | 55.6 | 56.1 | 57.8 | 58.6 |
| MASTER'S | ||||||||||
| Number | 5,218 | 5,597 | 6,272 | 6,513 | 6,699 | 7,002 | 7,255 | 7,731 | 7,603 | 7,082 |
| Percent | 18.3 | 18.2 | 19 | 18.9 | 19.4 | 19.9 | 20.5 | 20.6 | 21.1 | 20.5 |
| ADVANCED CERTIFICATES | ||||||||||
| Number | 19 | 18 | 26 | 3 | 31 | 8 | 14 | 11 | 13 | 8 |
| Percent | 0.1 | 0.1 | 0.1 | 0.1 | ||||||
| EDUCATION SPECIALIST | ||||||||||
| Number | 746 | 748 | 763 | 820 | 773 | 747 | 713 | 818 | 632 | 517 |
| Percent | 2.6 | 2.4 | 2.3 | 2.4 | 2.2 | 2.1 | 2.0 | 2.2 | 1.8 | 1.5 |
| PROFESSIONAL | ||||||||||
| Number | 696 | 673 | 660 | 676 | 692 | 723 | 740 | 708 | 774 | 767 |
| Percent | 2.4 | 2.2 | 2.0 | 2.0 | 2.0 | 2.1 | 2.1 | 1.9 | 2.1 | 2.2 |
| DOCTORATE | ||||||||||
| Number | 632 | 691 | 679 | 632 | 668 | 740 | 692 | 808 | 771 | 721 |
| Percent | 2.2 | 2.2 | 2.1 | 1.8 | 2.0 | 2.1 | 2.0 | 2.2 | 2.1 | 2.1 |
| SYSTEM TOTAL | 28,466 | 30,764 | 33,035 | 34,546 | 34,477 | 35,117 | 35,427 | 37,556 | 36,076 | 34,589 |


